The Ruffier-Dickson index is a test to measure aerobic endurance, and thus a person’s fitness level.
This index is a variant of the Ruffier index, defined by the French doctor James-Edward Ruffier.
According Wikipedia, the index is widely used in France. Actually the wiki article has not been translated to English as of now.
This test is based on a formula that serves to obtain a coefficient that gives us an assessment about our fitness level. Said coefficient is obtained by performing 30 squats in 45 seconds. Here you can see an example:
To calculate the index, the following parameters are defined:
-
`P_0` = Heart rate right before the exercise begins
-
`P_1` = Heart rate just when exercise finishes
-
`P_2` = Heart rate after one minute recovery
Now you can measure your Ruffier-Dickson index with my new app.

Using the app is pretty straight forward.
Just stay in rest position and press start. the following three phases will be automatically triggered:
-
15 seconds rest time, for estimation of `P_0`
-
45 seconds exercise time. Here you have to perform 30 squats. At the end of this phase `P_1` will be estimated
-
60 seconds recovery time, after which `P_2` and `I_d` are estimated
Hint: you can use this metronome to help you keep the rhythm. You need to set the the beats for minute at 40 bpm, and do one squat per beat (or, alternatively, at 80bpm, for up & down beats). Press start and you are good to go.
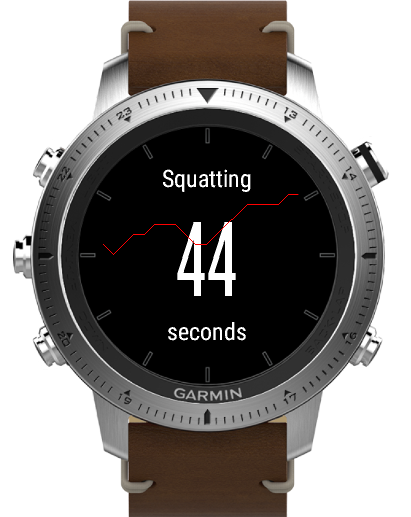
During the test, the watch will show you the phase you actually are in, and how many seconds remain till next phase:

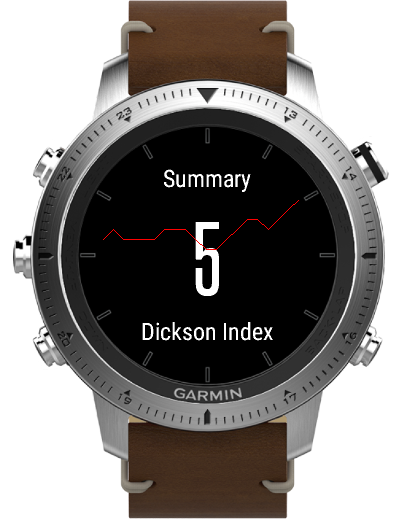
Once finished, the app will show the estimated index:

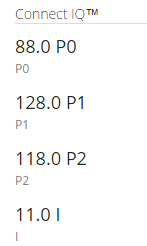
After syncing your will find in Garmin Connect all calculated parameters:

And of course, the heart rate chart during the 2 minutes of the test:

What I like about the test: It is fast and easy. You can repeat the test every 4 weeks, and see how your fitness level evolves.
In the end, if you are beginning to exercise and want to know if you are fit enough for the task, talk to a doctor.
Feel free to use the comment section below to ask any questions. Remember that you don’t need to create a Disqus account in order to comment: just write your comment, click on the “Name” field below, and the option “I’d rather post as a guest” will pop up.
Happy exercising! Cheerio
